.png)


.png)
.png)
A dashboard was created using the Netflix dataset from Kaggle to provide insights into the platform's movies, TV shows, and users' viewing habits. The dashboard is divided into two main sections, one for movies and TV shows and the other for viewing habits, and allows users to explore the content available on Netflix and understand the popularity and viewing habits of users.
.png)
This project used Tableau to analyze a video game sales dataset and create visualizations to understand the video game market. The analysis included exploring the top-selling game franchises, changes in sales over time, and the success of different publishers. Charts and graphs were used to uncover trends and identify patterns in the data. The goal of the project was to gain a deeper understanding of the video game industry.
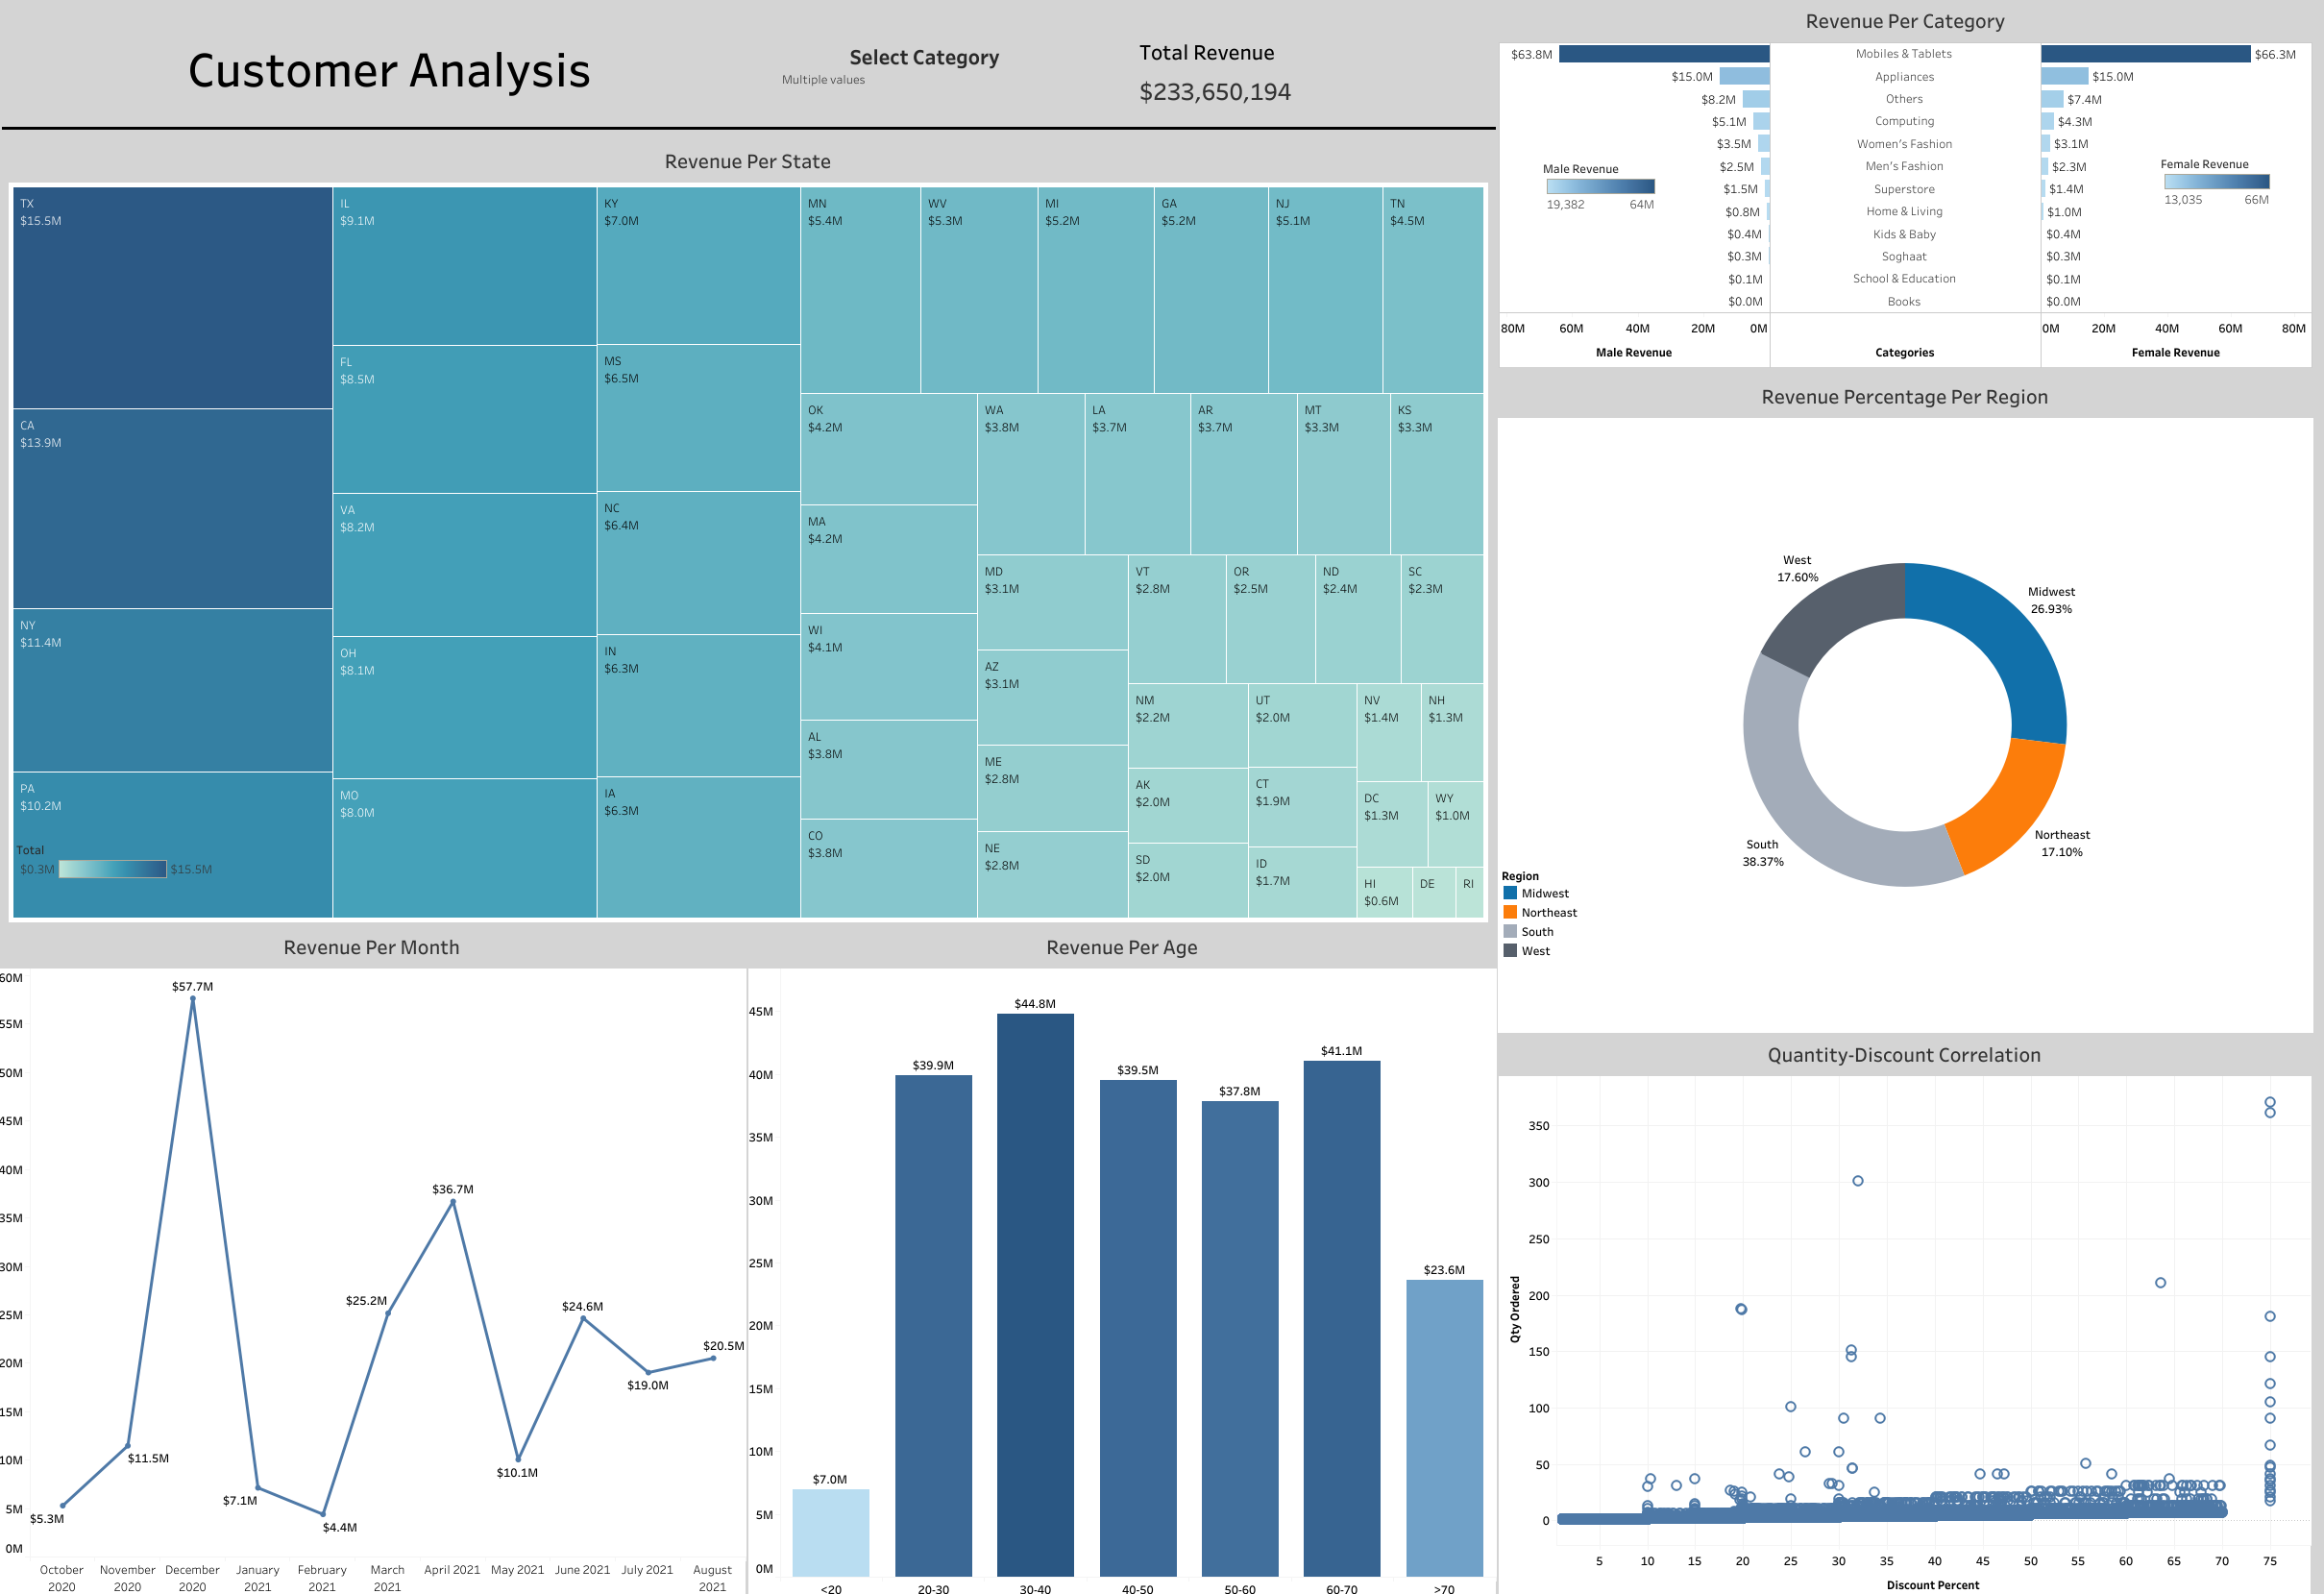
The Customer Analysis Tableau project was a data visualization project that aimed to gain insights into customer behavior and preferences through the analysis of an Excel dataset. We used Tableau to create interactive dashboards and charts to identify patterns and trends in customer behavior. The project allowed us to gain a better understanding of our customer base and make informed decisions about our marketing and sales strategies.

In this project, I created a database in SQL Server and imports the Rebrickable LEGO Dataset CSV files. They I used SQL queries, JOINS, CTEs, and WINDOW functions to answer questions about the data. The Rebrickable LEGO Dataset includes information on sets, parts, colors, and themes, and is provided in CSV format.
This project involves exploring a sales dataset to generate insights and analyzing sales revenue using SQL. The project also includes creating a customer segmentation analysis using the RFM technique and practicing skills such as importing a file into a SQL Server database, using SQL aggregate and window functions, working with subqueries and common table expressions, and using the SQL XML Path function. The project aims to improve skills in SQL, particularly in complex queries and data manipulation.

This project involves using Python to scrape data from the Amazon website. The goal is to extract information such as product names, prices, and ratings, and store it in a structured format for analysis. The project use libraries such as Beautiful Soup to navigate and parse the HTML of Amazon's web pages.